Scale CloudWatch Alarms with Metrics Insights Queries
Have you ever hit CloudFormation’s 500-resource limit while trying to properly monitor your Lambda functions? If you’re managing a large serverless application with comprehensive monitoring, this constraint can sneak up on you fast. Let me show you an elegant solution using CloudWatch Metrics Insights that reduces hundreds of alarm resources down to just a few.
The Resource Explosion Problem
Traditional Lambda monitoring is straightforward but resource-hungry. For each function, you typically create separate alarms for:
- Error rate monitoring
- Throttling detection
- Duration warnings
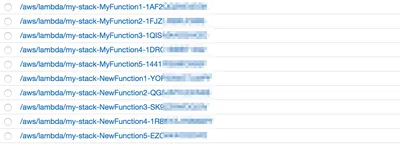
For 100 Lambda functions with 3 alarms each, you’ve already consumed 300 CloudFormation resources just for monitoring! Add in the actual Lambda Functions, IAM roles, policies, API Gateway resources, and other infrastructure components, and you’ll quickly hit that 500-resource ceiling.
Sure, you could split your CloudFormation stack into multiple nested stacks or create a separate Lambda Function to automatically manage alarms for all your functions. But that adds complexity and makes your infrastructure harder to manage. What if there was a better way?
CloudWatch Metrics Insights: SQL for Your Metrics
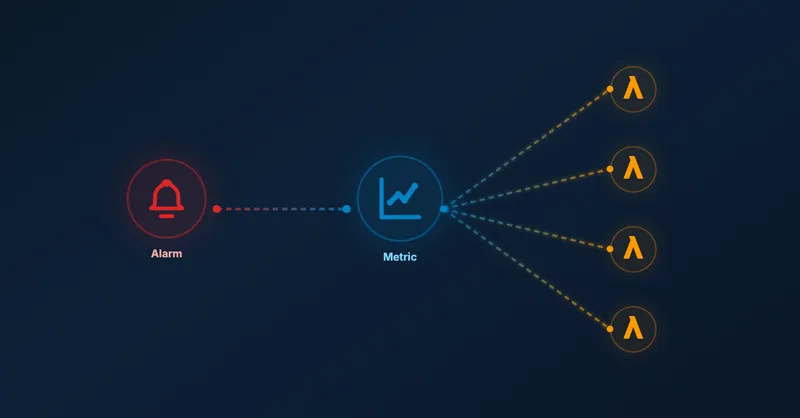
CloudWatch Metrics Insights provides a SQL-like query language that lets you aggregate and analyze metrics across multiple resources. The game-changer? You can create a single alarm that monitors all your Lambda functions at once.
Here’s how it works: instead of creating individual alarms per function, you write a Metrics Insights query that groups your Lambda functions by tags and monitors them collectively. When any function breaches your threshold, CloudWatch identifies which specific function triggered the alarm through contributor attributes.
Tag-Based Filtering
The key to this approach is resource tagging. You tag your Lambda functions based on their monitoring requirements:
// Tag functions that need high-priority error monitoring
cdk.Tags.of(sampleFunction).add('errorMetric', 'high');
Then your Metrics Insights query targets only the tagged functions:
SELECT SUM(Errors)
FROM "AWS/Lambda"
WHERE tag."errorMetric" = 'high'
GROUP BY tag."aws:cloudformation:logical-id"
ORDER BY SUM() DESC
This query:
- Sums all errors from Lambda functions tagged with
errorMetric=high - Groups results by CloudFormation logical ID (identifies which function)
- Orders by error count (worst offenders first)
Architecture Overview
The architecture is refreshingly simple compared to traditional per-function monitoring:

Instead of 300 individual alarms (100 functions × 3 alarm types), you maintain just 3 alarms:
- One for high-priority errors
- One for throttling
- One for duration
Each alarm uses a Metrics Insights query to monitor all relevant functions simultaneously. When an alarm triggers, CloudWatch provides contributor insights showing exactly which function caused the breach.
Beyond Lambda: Universal Pattern
While I’ve focused on Lambda functions here, this pattern works for any AWS service that publishes metrics to CloudWatch. You could:
- Monitor error rates across multiple API Gateway REST APIs
- Track DynamoDB throttling across all tables in a specific environment
- Aggregate ECS task failures by deployment group
The pattern remains the same: tag your resources, write a Metrics Insights query filtering by those tags, and create a single alarm that monitors them all.
Try it Yourself
Want to try it yourself? Check out the complete working example on GitHub with deployment instructions and test cases.
💡Before you try it, ensure you have enabled resource tags on telemetry data in your AWS CloudWatch settings. Also, it may take a few moments until the resource tags are available in CloudWatch. Your metric will not show any results until then.
Conclusion
CloudWatch Metrics Insights transforms how you approach monitoring at scale. Instead of creating hundreds of individual alarms that consume your CloudFormation resource budget, you create a few powerful queries that dynamically monitor tagged resources.
This approach offers several advantages:
- Resource efficiency: Drastically reduces CloudFormation resource consumption
- Infrastructure-as-code compliant: No external automation functions needed
- Flexible querying: SQL-like syntax with aggregations and filtering
- Scalability: Add new Lambda functions without touching alarm definitions
If you’re building large serverless applications or managing multiple Lambda functions, CloudWatch Metrics Insights should be in your monitoring toolkit. It’s particularly valuable when combined with other monitoring best practices like cleaning up old CloudWatch log groups and optimizing your CDK constructs.
Have you already tested it? Reach out to me on LinkedIn to share your experience!

Related Articles
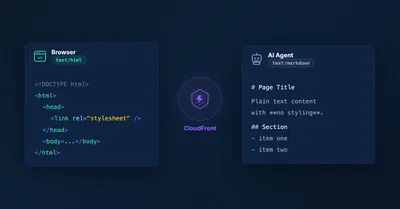
Serve Markdown for LLMs and AI Agents Using Amazon CloudFront
Learn how to serve Markdown to LLM and AI agent clients while keeping HTML for human visitors, using CloudFront Functions, Lambda, and S3 — the AWS equivalent of Cloudflare's 'Markdown for Agents' feature.
5 Ways To Bundle a Lambda Function Within an AWS CDK Construct
5 ways to bundle Lambda functions in CDK constructs: inline code, separate files, pre-build bundling, NodejsFunction, and Serverless App Repository integration.
Remove old CloudWatch log groups of Lambda functions
Automatically remove orphaned CloudWatch log groups from deleted Lambda functions. Python script using CloudFormation stack to identify and clean up old logs.
Using Spring Boot On AWS Lambda: Clever or Dumb?
Should you run Spring Boot on AWS Lambda? Detailed analysis of advantages, disadvantages, cold start impact, and GraalVM alternatives for Java serverless functions.